← all projects
case study · market intelligence

Web3 Ecosystem Workflow

Monitors sentiment, developer activity, and value of the top blockchain networks to give a daily report the ecosystem as a whole.
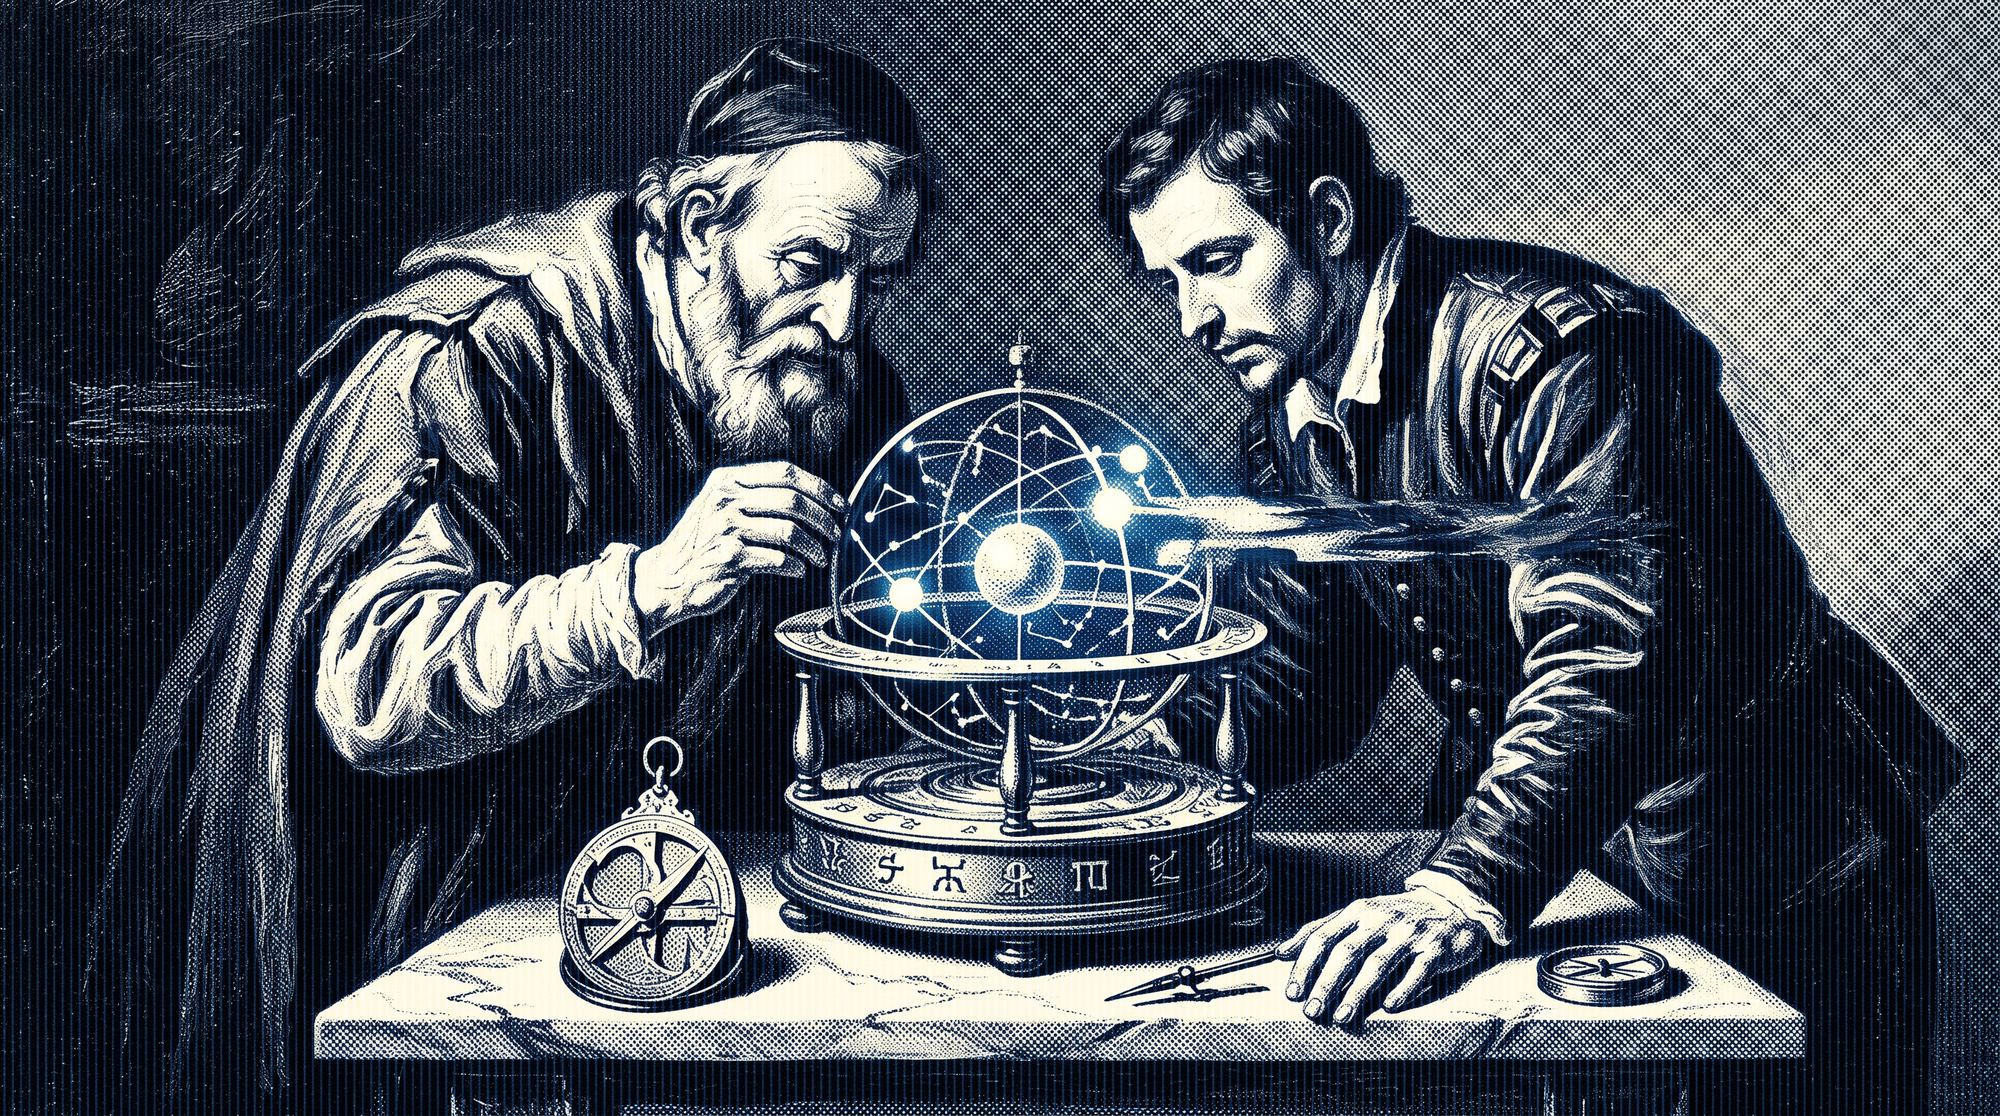
Renaissance-style illustration of a scholar examining a glowing armillary-sphere network model, representing the ecosystem workflow, in Prometrifi's dithered Digital Renaissance style.
the gap

Watching the chain manually doesn't scale past one protocol.

Tracking activity across even a handful of protocols means jumping between block explorers, dashboards, and market feeds — and doing it again the next day. Most of what's worth knowing is buried in noise, and by the time someone's pieced it together by hand, it's often stale.

how it runs

A scheduled pipeline, not a person refreshing tabs.

01

Pull

On-chain activity and market data are pulled on a fixed schedule across the protocols being tracked.

02

Filter

Routine noise gets separated from activity that actually signals something — a shift worth a second look, not every transaction.

03

Structure

What's left is organized into a consistent, readable format — not a raw export someone still has to interpret.

04

Deliver

Structured intelligence lands on schedule, ready to act on rather than requiring another round of digging.

built with

The actual stack.

n8n workflow automation LunarCrush social/sentiment data on-chain & market data sources Postgres snapshot storage
where it stands
Running on a fixed daily schedule today, across 10 tracked chains.
the architecture

One pipeline, 4 stages.

01 Pull On-chain and market data, pulled on a fixed schedule.
02 Filter Noise separated from what's actually worth flagging.
03 Structure Organized into a consistent, readable format.
04 Deliver Structured intelligence, ready to act on.
proof of work — the pipeline

The n8n canvas, in full.

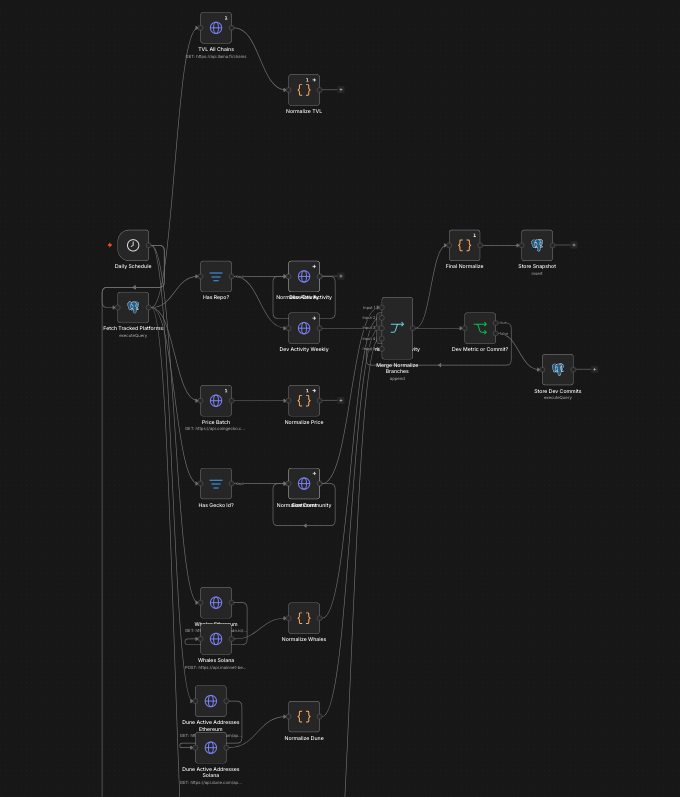
n8n workflow canvas: daily schedule fetching tracked platforms, branching into TVL, dev activity, price, sentiment, and whale/address tracking, merging into a final normalize and snapshot/commit storage step.
The daily pipeline — schedule trigger fans out into TVL, dev activity, pricing, sentiment, and whale/address tracking, then merges and normalizes before it's stored.
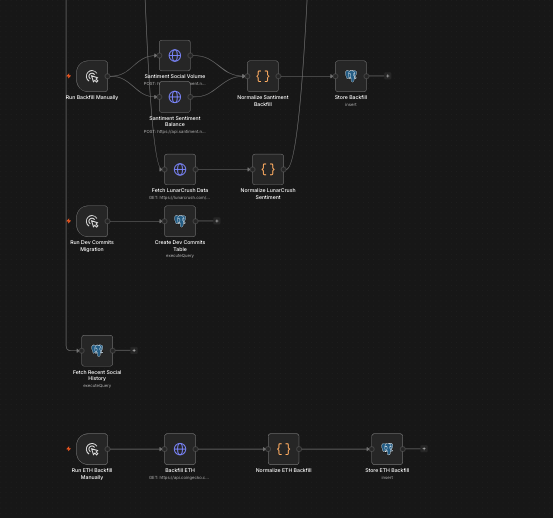
Supporting n8n workflows for manual backfill and historical migration of social, sentiment, dev commit, and ETH data.
Backfill and migration jobs that keep the historical record intact — same pipeline, run on demand instead of a schedule.
proof of work — sample output

What actually lands.

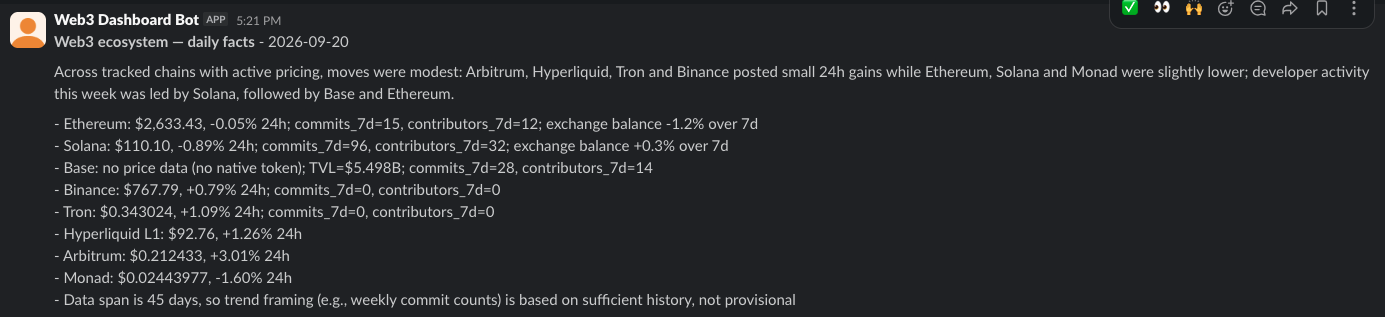
Slack message from Web3 Dashboard Bot: daily facts digest listing price moves, commit activity, and exchange balance changes across tracked chains.
The daily digest, delivered straight to Slack — plain-language read on price moves, dev activity, and exchange flows, not a spreadsheet someone has to open.
proof of work — the dashboard

Ledger & Ledgerline.

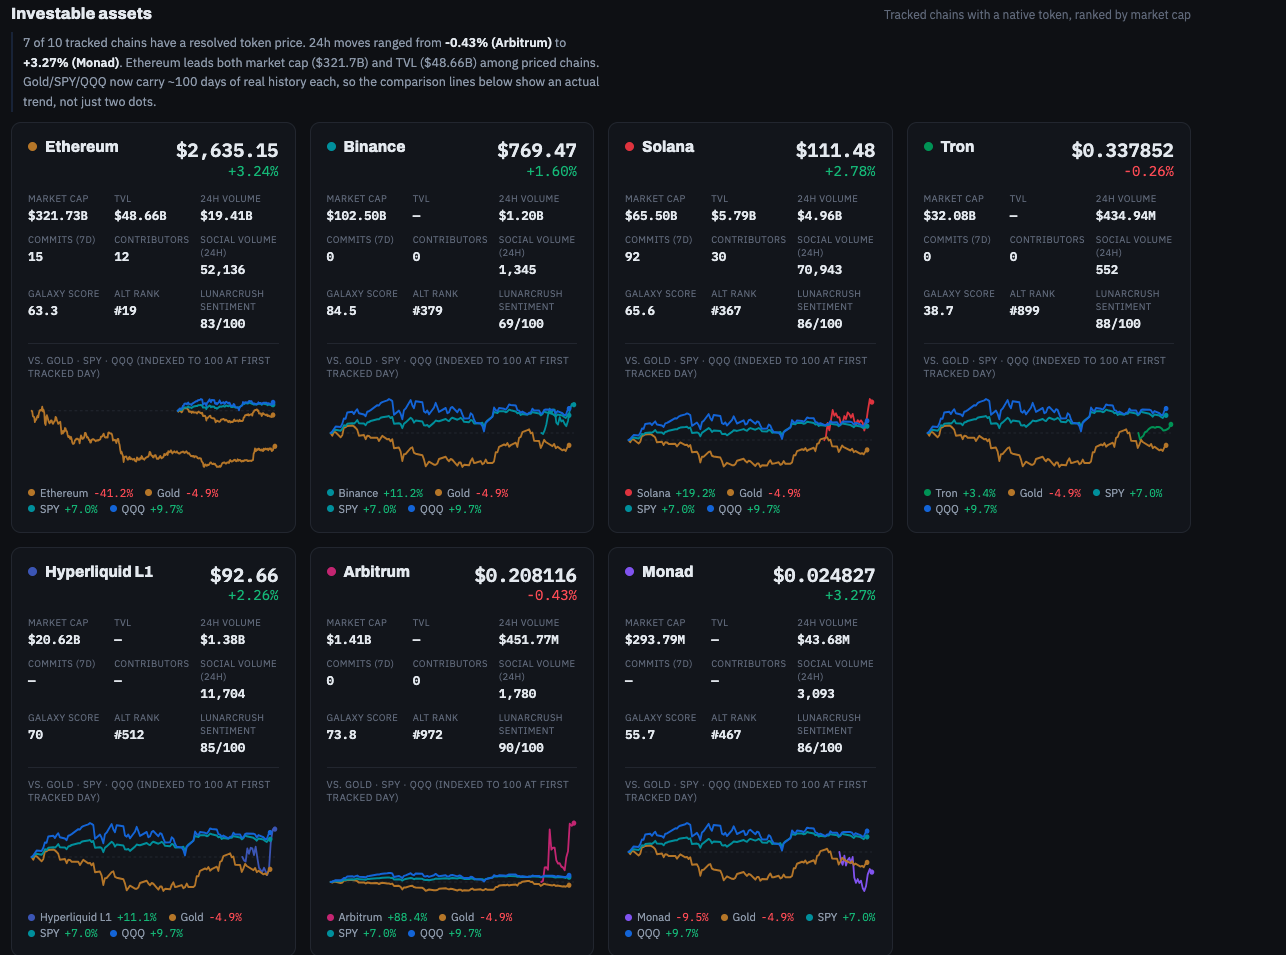
The structured output also feeds a standing dashboard — macro context, intermarket comparisons, and per-chain fundamentals in one read.
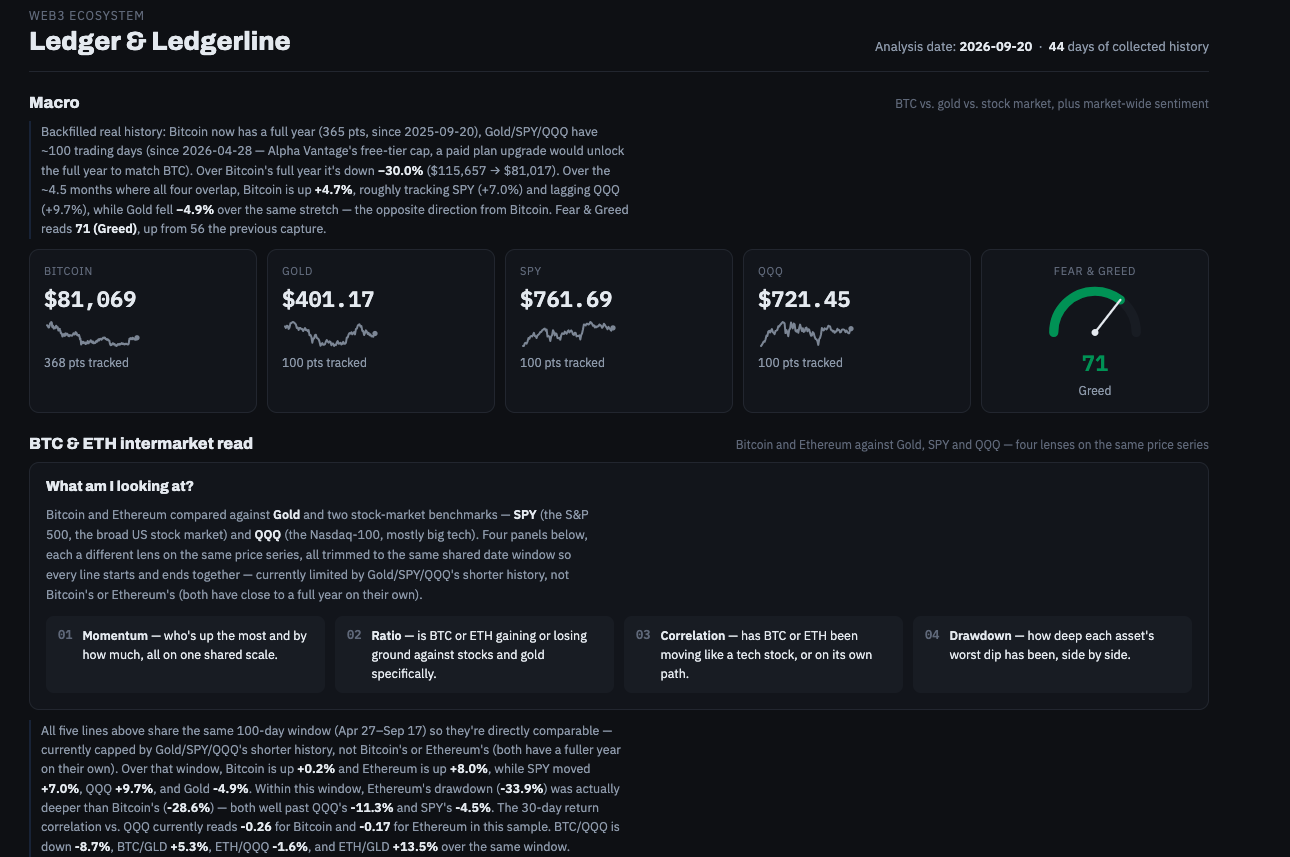
Ledger and Ledgerline dashboard: macro panel with Bitcoin, Gold, SPY, QQQ, and Fear and Greed index, plus a BTC and ETH intermarket comparison section.
Macro context first — Bitcoin against gold and the broader stock market, with a Fear & Greed read alongside it.
Investable assets grid showing Ethereum, Binance, Solana, Tron, Hyperliquid, Arbitrum, and Monad with market cap, TVL, volume, dev activity, and social metrics per chain.
Then per-chain fundamentals — price, TVL, dev activity, and social sentiment for every tracked chain, side by side.
let's work together

Have a project in mind?

hello@prometrifi.co
← back to all projects